
Navigating the Scenic Highway 30A real estate market requires more than just knowing what is for sale; it requires up-to-date market intelligence. Whether you are considering buying a coastal retreat, listing your beachfront estate, or evaluating your investment portfolio, making informed decisions comes down to having clear, transparent data.
To make this seamless, our real-time Market Statistics Page brings the latest local real estate metrics directly to you.
Here is how you can use this tool to track trends across 30A's beach communities and key market indicators.
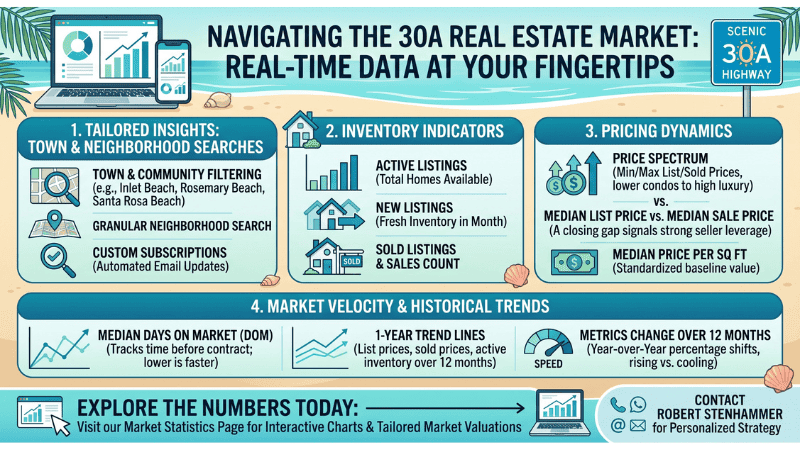
Tailored Insights: Town & Neighborhood Searches
No two communities along 30A are exactly alike. The luxury market in Rosemary Beach or Inlet Beach often moves differently than trends in Santa Rosa Beach, Watersound, or Miramar Beach.
On our Market Statistics Page, you can customize your view:
-
Town & Community Filtering: Select specific coastal hubs—such as Inlet Beach, Rosemary Beach, Seacrest, Watersound, Sandestin, Carillon Beach, or Santa Rosa Beach—to immediately isolate localized metrics.
-
Granular Neighborhood Search: Drill down past town-level data by typing a specific subdivision or neighborhood into the search field to get micro-market insights for targeted communities.
-
Custom Subscriptions: Click "Subscribe to this report" or "Manage my subscriptions" to receive automated updates directly to your inbox whenever new market data generates.
Understanding the Key Market Metrics
Our live dashboard automatically compiles real-time listing, sales, and timing metrics. Here is a breakdown of what these numbers mean when evaluating the market:
1. Inventory Indicators
-
Active Listings: The total count of homes currently available for purchase on the market.
-
New Listings: The volume of fresh inventory introduced during the selected month. Monitoring new listing volume helps reveal seasonal patterns and incoming inventory pressure.
-
Sold Listings & Sales Count: The number of properties that successfully closed escrow within the timeframe.
2. Pricing Dynamics
-
Price Spectrum (Min/Max): Highlights the absolute entry-level price point up to the highest luxury list or sold price in the area (e.g., ranging from lower-tier condos to multi-million dollar beachfront estates).
-
Median List Price vs. Median Sale Price: Comparing the median price of active homes against closed sales highlights market alignment. A closing median sale price close to or above the list price indicates strong seller leverage, while a wider gap signals room for buyer negotiation.
-
Median Price Per SqFt: Standardizes pricing across properties of varying sizes, giving a baseline for local home values.
3. Market Velocity & Historical Trends
-
Median Days on Market (DOM): Tracks how many days properties typically sit on the market before going under contract. Lower DOM signals rapid market pace, while higher DOM provides buyers with leverage and selection time.
-
1-Year Trend Lines: Line graphs track historical shifts in list prices, sold prices, and active inventory levels over 12-month rolling periods.
-
Metrics Change Over 12 Months: Bar charts showcase percentage shifts (+/-) year-over-year across key variables, instantly showing whether price and pace trends are rising or cooling.
Explore the Numbers Today
Whether you are watching price-per-square-foot trends or waiting for the right moment to make a purchase, access to raw real estate data ensures you stay ahead of the market.
Explore these interactive charts and filter by your favorite beach town directly on our Market Statistics Page.
Have questions about what these numbers mean for your property or purchase goals? Contact Robert Stenhammer today for a tailored market valuation or personalized buying strategy.

Socials